Experimental database
Digitized experimental IR spectra
Real gas-phase FTIR spectra digitized from the NIST Chemistry WebBook (Standard Reference Database 69), parsed to a uniform 400–4000 cm⁻¹ grid and stored on-site. Search, filter by functional class, and overlay measured spectra in the viewer.
Extraction fidelity — reconstructed vs original
Each stored spectrum is the digitized extract; plotting it reconstructs the trace. Overlaying that reconstruction (blue) on the original NIST points (grey) confirms the unit conversion + resampling are faithful — mean round-trip RMSE 0.36% transmittance across all 1,000 spectra (median 0.30%).
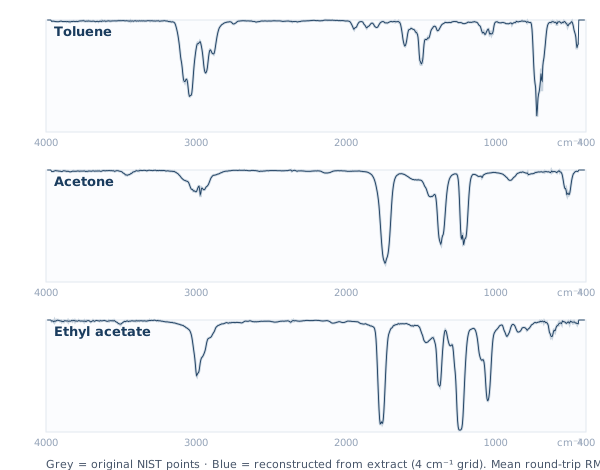
Reconstruction vs original. Blue (extract) sits on grey (raw NIST) almost perfectly. The only measurable deviations are on small molecules with sharp gas-phase rotational fine structure (water, formaldehyde, methane), which any finite grid undersamples — a sampling limit, not a digitization error.
Provenance & honesty
Every spectrum here is a genuine measurement from NIST SRD 69 (gas phase, MSDC-IR / Sadtler collections), digitized from the original JCAMP-DX records — absorbance converted to transmittance, wavelength axes converted to wavenumber, all resampled to a common grid without smoothing. Being gas-phase, band positions can sit higher than condensed-phase textbook values (e.g. carbonyls). Involatile species (amino acids, nucleotides, polymers) are absent from this gas-phase set and remain reconstructions on their data pages.
Other experimental IR sources
NIST is the main freely-rehostable source, so it is what we store. Each entry above also links out to two larger libraries — SDBS (AIST Japan, ~54,000 compounds) and Wiley SpectraBase — whose licenses permit viewing but not redistribution, so we link rather than copy. Other openly-licensed sets surveyed are small or off-domain: the CC0 Open Spectral Database (beta, limited IR), the CC-BY Open Specy library (~325 FTIR, microplastics/polymer-focused), and the PNNL NWIR quantitative gas-phase set (~500 species, high-resolution, but not freely downloadable). Condensed-phase organic IR at scale simply isn't available under an open, rehostable license — which is exactly why this NIST-based set, fidelity-validated, is worth maintaining.